|
<< Click to Display Table of Contents >> Picked locations (and gradients) |
  
|
|
<< Click to Display Table of Contents >> Picked locations (and gradients) |
|
Purpose
To report and mark the level/Z value or downhill gradient at any location within the model area. Results may be displayed in the dialogue, presented at the command prompt or added to the drawing.
Operation
Select the model.
As the cursor is moved over the modeled area the level/Z value, downhill gradients and direction of downhill slope are dynamically displayed below the command prompt.
Pick the plan location where you need to see the interpolated level.

Typical setting to annotate interpolated levels
Pick new points until Enter
"On" for typical use so that the dialogue only appears again after picking a number of points and then Return.
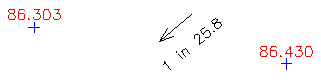
Gradients
Set arrow only or arrow and annotation "on" to annotate downhill gradients and turn Mark levels "off".
Levels
Set Mark levels "on" to annotate interpolated levels and choose marking option – Interpolated level is suitable for typical use and will insert a PI block whose Level attribute displays the interpolated level value.
Set the layer for the interpolated levels or gradients to be drawn on and check nominal scale. Options also exist to control the downhill arrow length and add a constant to the interpolated level value.