|
<< Click to Display Table of Contents >> Water volume / level graph |
  
|
|
<< Click to Display Table of Contents >> Water volume / level graph |
  
|
Purpose
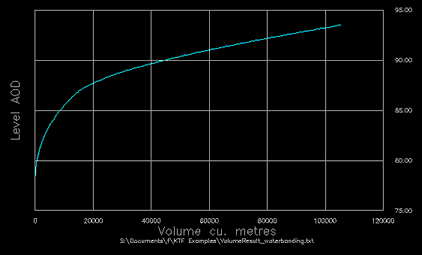
Draw a graph from water volume results, usually of a reservoir or a pond. The graph shows the volume at various AOD levels.

Water volume by AOD level
Operation
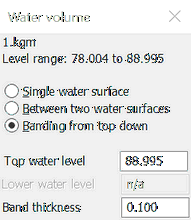
Prerequisite is to calculate the water volume by using the Banding option and have the result written to a file. Then run this function, select the result file and pick a location for the graph.

Calculating the water volume with Banding option.