|
<< Click to Display Table of Contents >> Tolerances from Master String to 3D Polyline(s) |
  
|
|
<< Click to Display Table of Contents >> Tolerances from Master String to 3D Polyline(s) |
|
Purpose
To compare a design string defined by its relationship from a Master String to an existing approximately parallel 3D Polyline (the existing 3D Polyline) and show if the levels from the specified gradient/cross fall from the Master String are within certain tolerances when compared to the existing 3D Polyline.
Typical use would be to compare the levels along an existing channel with those calculated from the centre-line projecting to the channel at specified gradient to indicate where the fall is “too flat”. Another use would be to study the fall from a 3D Polyline representing building thresholds to a kerb (an existing 3D Polyline) to report lengths where there is insufficient fall. The main output is to show lengths along the existing 3D Polyline where it is within, above or below specified level differences as presentation 3D Polylines. Note that as an alternative to starting with a Master String a 3D Polyline may be selected in which case the vertical geometry may be from the 3D Polyline or a .vtg file.
, existing 3D Polyline (cyan) to be compared with the \"design fall\" from the Master String")
Horizontal alignment (white), existing 3D Polyline (cyan) to be compared with the "design fall" from the Master String
Operation
Pick the 2D Polyline representing the Horizontal Alignment (or 3D Polyline). Select the .vtg file if not using vertical geometry from a 3D Polyline.
Pick the existing 3D Polyline and the dialogue appears :-
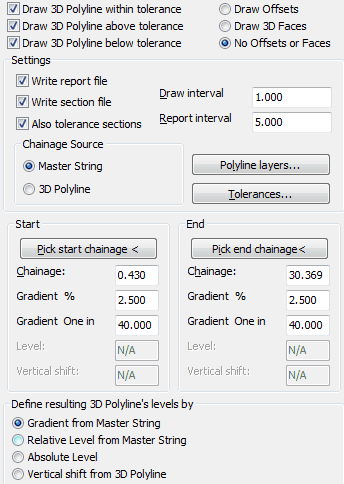
Outputs :-
Draw 3D Polyline within tolerance
Draw 3D Polyline above tolerance
Draw 3D Polyline below tolerance
All the above "presentation 3D Polylines" are defined from the Master String to the plan location of the existing 3D Polyline with specified gradients and should be drawn to show the results.
Draw Offsets |
Not “on” for typical use. |
Write report file |
To list chainages, co-ordinates and tolerance data. |
Write section file |
This is defined from the Master String to the plan location of the existing 3D Polyline with specified gradients. |
Also tolerance sections |
This is the same as above but split into three section files to show lengths within, above and below tolerances. |
Ensure that the chainage source is correct.
Polyline layers...
Set the layers and colours for drawing the presentation 3D Polylines on.
Tolerances :-
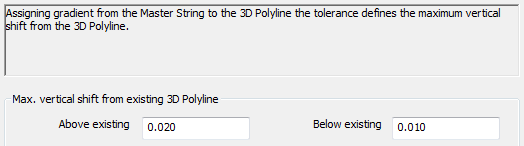
If working with Gradient from Master String enter the difference in level tolerances above and below the existing 3D Polyline e.g. 0.020 and 0.010.
If working with Relative Level from Master String enter the gradient tolerances above and below the existing 3D Polyline.
If working with Absolute Level or Vertical shift enter the gradient tolerances above and below the existing 3D Polyline.

3D Polylines showing lengths below, within and above tolerences

From the Master String to the 3D Polyline in cyan
Red |
Design/Specification is below the existing 3D Polyline and out of tolerance. |
Green |
Design/Specification is above, below or exactly on existing 3D Polyline but within tolerances. |
Blue |
Design/Specification is above the existing 3D Polyline and out of tolerance. |
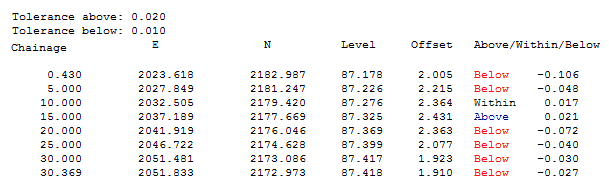
Note that the results report if the design or specified string (related from the Master String with a standard cross fall of 1 in -40 for example) is above, within or below the existing 3D Polyline representing a channel for example. The .kdr report file looks like :-

Colour bars drawn from the output section file by menu item Sections, Superimpose, Tolerances